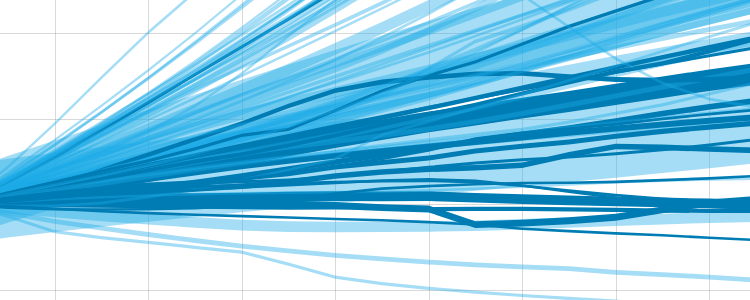
How the World Population Changed During the 21st Century
I investigated population data from The World Bank and built an interactive D3.js chart that shows how the number of residents change in 76 countries from 2000 to 2017. Grouping states based on income shows a negative correlation between wealth and growth rate and I provided some context for the entries with the most notable changes.
Read More → GitHub →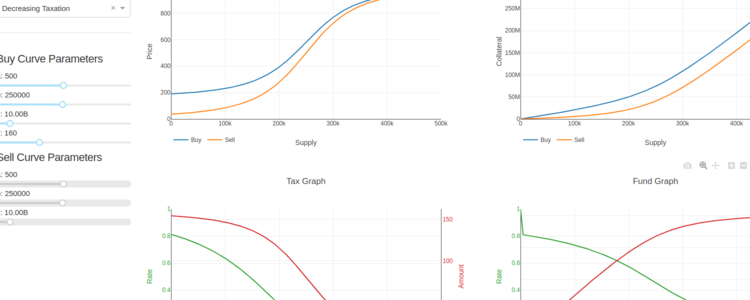
Designing Different Fundraising Scenarios Using Token Bonding Curves
To accompany a recent article on using Token Bonding Curves for continuous fudnraising I created an interactive dashboard with Dash. The user can choose between a variety of different scenarios, fine-tune parameters and observe changes in real-time.
Read More → GitHub →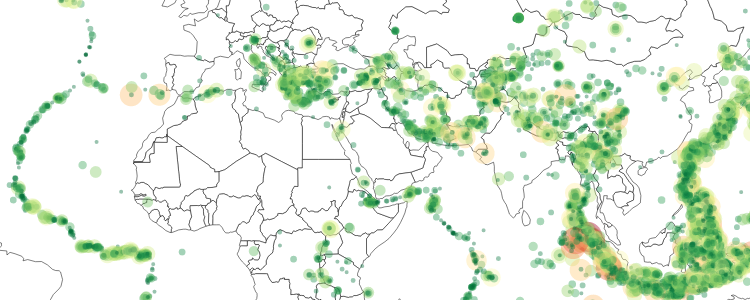
Interactive Visualization of Earthquake Locations using D3.js
This is the first data visulaization I have created using D3.js. Earthquake data published by the NEIC is plotted on an interactive worldmap and an animation shows occurrences over time.
Read More → GitHub →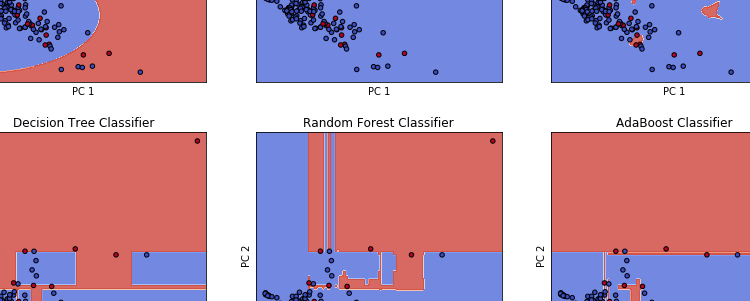
Identifying Persons of Interest in the Enron Corpus Dataset using Machine Learning
By training and testing various machine learning classifiers on public Enron financial and email data, I built a model that can reliably identify Enron employees who were more likely to be involved in fraudulent activities that lead to the Enron accounting scandal.
Read More → GitHub →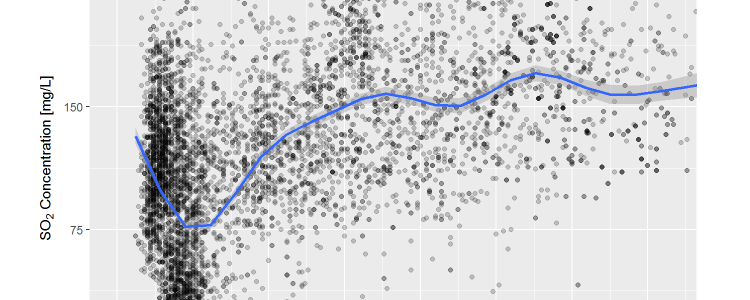
Exploratory Data Analysis of Wine Quality in R
In this project, I used R and applied exploratory data analysis techniques to examine distributions, outliers and relationships between variables in a data set containing physicochemical properties of red and white wines. I identified the parameters that influence wine quality the most and created a simple regression model to predict wine density based on the concentrations of its ingredients.
Read More → GitHub →
Wrangling of OpenStreetMap Data from Zürich
Data munging techniques were used to assess the quality of OpenStreetMap data from Zürich. Afterwards, the data was cleaned programmatically, a storage schema was developed and the data transferred to an SQL database. The data was explored by querrying the different tables and some interesting findings about the area were gathered.
Read More → GitHub →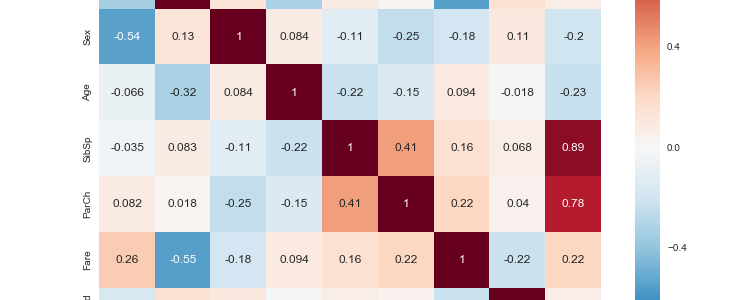
Analysis of Titanic Survival Data
I conducted a thorough data analysis of passenger data from the Titanic sinking in 1912. By exploring the features found in the set I wanted to find out which of them influenced passenger survival the most and which passenger groups were most likely to survive the horrible disaster.
Read More → GitHub →
Statistical Investigation of the Stroop Effect
Using descriptive statistics I looked at the results of a Stroop experiment. I set up a hypothesis about the outcome and performed a Student's t-test to assess it on a statistical level.
Read More → GitHub →